Effect Site Concentration During Propofol TCI Sedation
A Comparison Of Sedation Score With Two Pharmacokinetic Models
Barakat A1,2, Sutcliffe N2, Schwab M1,2
1) Glasgow University, UK, 2) Golden Jubilee National Hospital, Glasgow, UK
Background:
TCI pumps incorporate a programme that is based on a pharmacokinetic/ pharmacodynamic (PK/PD) model to calculate the predicted plasma and effect site concentration of the drug. The Diprifusor manufactured by Astra- Zenica was the first available propofol TCI pump which was based on the Marsh PK/PD model1. More recently a different PK/PD model known as the Schnider model2 has been introduced. During induction of anaesthesia, the Schnider model predicts faster propofol effect site equilibration than the Marsh model. We aim to study which PK/PD model correlates better with the clinically observed effect of propofol as assessed by the responsive component of the Observer Assessment of Alertness/Sedation Score OAAS3,4 (table1).
Table 1. Responsive Component of Observer Assessment of Alertness/Sedation Score OAAS
|
Score |
Responsiveness |
|
5 |
Responds readily to name spoken in a normal tone. |
|
4 |
Lethargic response to name spoken in a normal tone. |
|
3 |
Responds only after name is spoken loudly and repeatedly or both. |
|
2 |
Responds only after mild prodding or shaking. |
|
1 |
Does not respond to mild prodding or shaking. |
|
0 |
Does not respond to noxious stimulus. |
Patients and Methods:
After informed consent, we studied 20 unpremedicated patients undergoing surgical procedures under spinal anaesthesia with propofol sedation. Patients were observed and assessed for the responsive component of the OAAS score as they were sedated by propofol TCI to a target concentration of 2mg/ml. Patients were assessed every 30 seconds for their OAAS score for 15 minutes unless they scored a sedation score of 0 before the end of the observation period. Half of the patients were sedated using Schnider PK/PD model with effect site concentration target and the other half were sedated with Marsh PK/PD model with plasma concentration target. A PK/PD simulation program (TIVA trainer) was used to calculate the effect site concentration predicted by both the Marsh and Schnider models.
Results:
Demographic Data: Table 2 shows patients data
Table 2: Demographic Data: Mean (Range)
|
|
Marsh |
Schneider |
Overall |
|
Age |
66.9 (52-88) |
59.1 (38-70) |
63.8 (38-88) |
|
Weight |
75.0 (56-99) |
77.3 (69-90) |
67.1 (56-99) |
|
Height |
160.1 (148-170) |
164 (153-178) |
161.7 (148-178) |
Sedation Score:
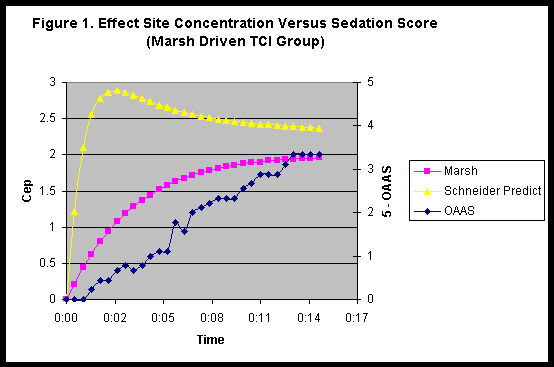
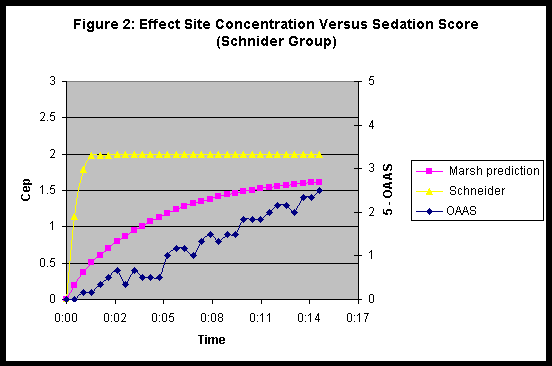
Figures 1 & 2 show the propofol effect site prediction and the recorded sedation score for patients sedated by the Marsh and Schneider models respectively. We have plotted the OAAS sedation score as 5 minus OAAS score to generate a scale that increases with increased depth of sedation.
Conclusions:
The changes in sedation score are better mirrored by the effect site prediction generated by the Marsh model even when propofol was administered by Schneider model. The achievement of a certain level of sedation was actually slower in patients sedated by Schneider model in effect control TCI compared to the same target in Marsh plasma controlled TCI.
References:
1) Marsh B, White M, Morton N, Kenny G. Pharmacokinetic model driven infusion of propofol in children. Br J Anaesth.1991;67(1):41-8.
2) Schnider TW, Minto CF, Shafer SL et al. The influence of age on propofol pharmacodynamics. Anesthesiology. 1999; 90(6):1502-16.
3) Glass PS, Bloom M, Kearse L et al. Bispectral analysis measures sedation and memory effects of propofol, midazolam,isoflurane and alfentanil in healthy volunteers. Anesthesiology. 1997; 86(4):836-47.
4) Doufas AG, Bakhshandeh M, Bjorksten AR et al. Automated responsiveness test (ART) predicts loss of conciousness and adverse physiologic responses during propofol conscious sedation. Anesthesiology. 2001; 94:585-92.

